


We no longer live in a world where we can assure our business growth with just the raw data. Being in the digital world and surrounded by interactive BI tools we can swiftly transform raw intimidating data into valuable insights. Power BI is one such platform that emerged as a trusted BI tool for modern enterprises.
You can now easily build Power BI Report and gain a detailed view of any data stream. In addition, Power BI Dashboard and reports help you to gain live reports for evidence-based decision-making. And it does not come as a shock to us to see the popularity surging of the brilliant tool.
Power BI Reporting services help both technical and non-technical experts to see the data, analyze it and use it. Since it is essential for a tool to be competent to serve multiple domains, Microsoft via Power BI offers various types of Power BI reports.
So, no matter what domain you serve in, what size of company yours is, you will always have a type of Power BI Reports that suits well to your needs.
In this blog post, we will enlighten you with various types of Power BI Reports.
Types of Power BI Reports
Classified in six major categories, here types of Power BI Reports
1. Digital Marketing Reports
The digital marketing reports in Power BI offer a clear KPI summary of the digital marketing campaigns. With this type of Power BI Report, managers can optimize the budget, along with enhanceing the revenue potential of organizations' advertising.
Power BI’s ability makes it easy to spot the issues and potential problem areas.
Any digital marketing report in Power BI will benefit you with,
- Thorough analysis and comparison between Cost Per Click (CPC) and Cost Per Thousand Impression (CPTM)
- Monetary expenditure on the advertisement at different periods
- Simple visuals of Bounce rate and Cost Per Acquisition
- Average cost spent on per click
- Comparison between Cost Per Acquisition and the total number of conversions

2. Website Analytics Reports
The website analytical report in Power BI takes care of everything related to the website. Right from delivering valuable insights into the website performance to helping the SEO team to calculate the website analytics, you get it all. Daily, it focuses on the following website-related information:
Website Conversion: It presents visitor behavior, short-term trends, sales conversion ratio, keyword rankings, etc.
Bounce Rate: A bounce rate is a way to measure the time spent by a visitor on a page or website. Other things it showcases are the average page views by visitors, the last page viewed, etc.
Website Visits: This shows the data related to website performance, visitor metrics, site metrics, total new visits as per the date, and total visits by country.
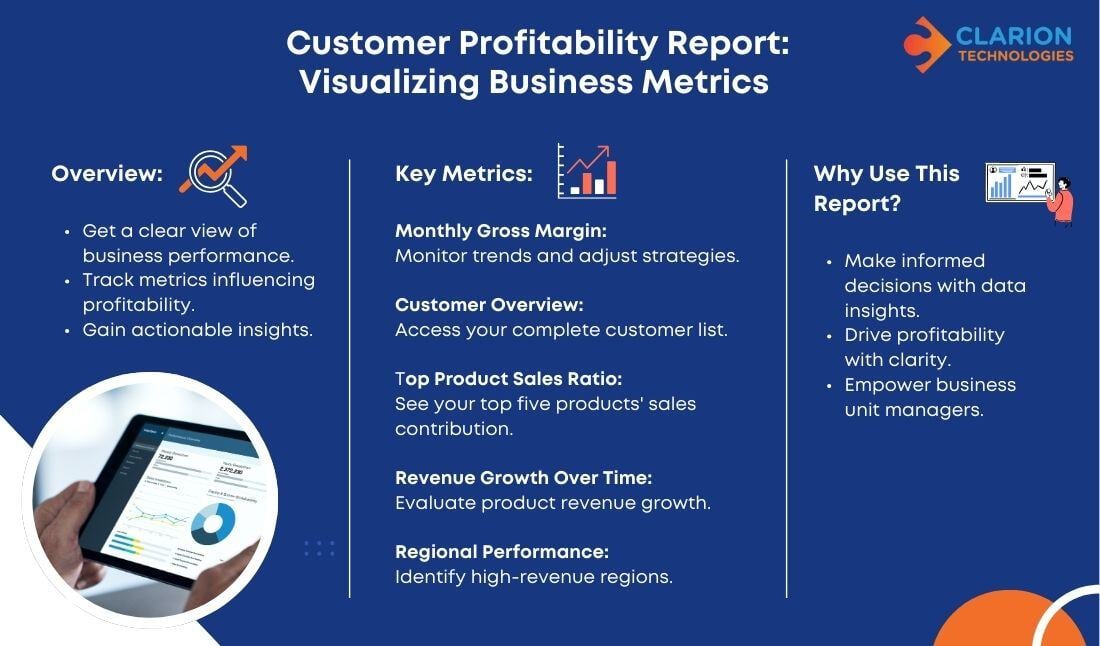
3. Customer Profitability Reports
4. Sales and analysis reports
Sales and analysis reports in Power BI are a savior of the sales team. You can download the essential report samples for your reference. The sales team already has too much on their plate. This report eases their work and helps you get:
- Various business trends in different periods
- The ratio of company’s sales to total industry sale
- Competitors list
- Track the regions of business operation
- Total sale year-to-date variance

5. HR Analytics Report
If you wish your Power BI Developers to give you some instrumental insights into the HR department, then the HR Analytics Report of Power BI is what you need.
It enables the HR people to make strategic decisions and make plans that surge the efficiency.
With this report, you get the details like,
- Track of the new hires and attrition
- Spreading the rightful candidates across various locations
- Track the active employees and new hire count
- Spotting hire and attrition trends
6. Financial Analysis Report
The beneficiary of the financial analysis report is the organization's, Chief Financial Officer. It shows various financial metrics that smoothen the process of financial planning.
It also presents the aspects like:
- Gross Profit
- Assets
- Total Expenses
- Operating Income
- Liabilities
- Gross Margin
- Expenses
- Revenue
- Profit and Loss
These were the powerful and different types of Power BI reports that works magic for different organizational demands.
Conclusion:
Power BI is a powerful tool that can uniquely accelerate your business growth. Clarion Technologies excels in Power BI Consulting and also helps you get a strong team of Power BI Developers. To know more, contact us.


