


Debugging is an important phase for any app development as it ensures the code written will perform as expected. There are several PHP debugging techniques, which can spare you innumerable hours when coding. A simple technique is turning on error reporting and slightly advanced one involves using the print statement.
In this list, Xdebug is the PHP extension that supports PHP scripts, debugging with several valuable debug details. It includes function traces & stack traces in error messages, protection for infinite recursions and memory allocation. This excellent debugging extension can be used more productively if you integrate with an IDE. Notepad++, Sublime text and NetBeans are few leading IDEs, which offer support to debug PHP code with simple configurations.
1. PHP debugging in Notepad++
Sometimes, you don’t want an IDE to build some simple PHP projects. In that case, you can use a basic editor like Notepad++. With the help of the DGBP plugin, you can debug your PHP scripts in this editor itself. Systematic instructions to configure the setup are:
- Considering you have Notepad++ installed on your system, download the latest version of Xdebug Plugin.
- Unzip the folder and copy the Xdebug dll file, to the directory of PHP extension.
- Next, you have to configure Xdebug to make it recognized by PHP. Open ini and add the following lines:
|
[xdebug] zend_extension_ts="c:/wamp/php/ext/php_xdebug-2.0.3-5.2.5.dll" xdebug.profiler_output_dir = "c:/wamp/tmp/xdebug" xdebug.profiler_output_name = "cachegrind.out.%p" xdebug.profiler_enable = 0 xdebug.profiler_append=0 xdebug.extended_info=1 xdebug.remote_enable=1 xdebug.remote_handler=dbgp xdebug.remote_mode=req xdebug.remote_host=127.0.0.1 xdebug.remote_port=9000 xdebug.idekey=xdebug xdebug.remote_log="c:/wamp/tmp/xdebug/xdebug_remot.log" xdebug.show_exception_trace=0 xdebug.show_local_vars=9 xdebug.show_mem_delta=0 xdebug.trace_format=0 |
- Then, create the ‘xdebug’ folder and restart your Apache service.
To debug the PHP script on Notepad++, you need to install and configure the DBGP plugin:
- First, download the latest version of the DBGP Plugin. The plugin installation is very simple, just unzip the folder, copy the dll file, to the Notepad++ plugins folder, and restart your editor.
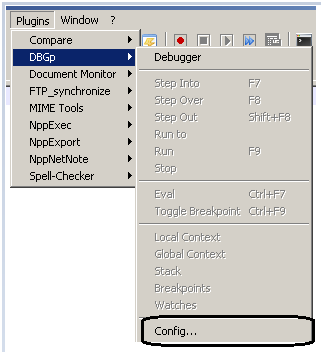
- Now, it’s time to configure DBGP. To open the configuration screen in Notepad++, Go to “ Plugins/DBGP/Config”:
You will get a screen like this: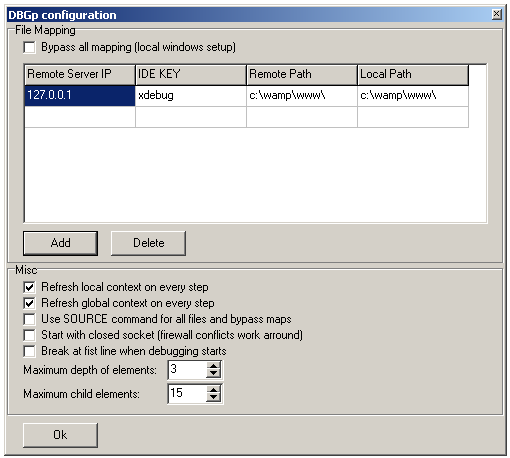
Image source: stackoverflow
Here, the remote server IP is your server IP, and IDE is the value of the GET parameter. The next fields are remote and local source folders. While filling the details, make sure the setting specified in the php.ini file should match with IDE KEY and click Ok.
- Open the PHP file you want to debug in the Notepad++ and add a breakpoint to the script. You will see the Notepad++ icon blinking on the taskbar. Click on it and start debugging.
What is Breakpoint?
Breakpoints are referred to as the points where you can intentionally stop or pause your program. If the debugger finds a breakpoint during execution, it stops at that point and enables you to check variables in debugging window and step through any code following the breakpoint.
You must set breakpoints in your files to inform the debugger where to stop during execution. A breakpoint can be set from the editor by clicking the left margin of the editor on the line. The breakpoint can be removed by clicking its badge.
You can also disable breakpoints temporarily. To do that just right click on breakpoint badge and deselect breakpoint enabled option. Which toggles the breakpoint into disable state from enable, you can see the grey badge in the left margin.
In these ways, developers can easily debug in code without refreshing multiple times in the browser that can save valuable time.
2. PHP debugging in sublime
The sublime is a text editor & IDE. This editor comprises various plugins, which makes debugging easier with several advanced debugging features. The main advantage of using Sublime is it allows you to easily extend with several packages. Here are the instructions for extending the Xdebug package:
- Install sublime editor. If you already have, skip this step and continue with the integration of Xdebug with Sublime.
- Next, you need to install Xdebug client package using the Sublime Text Package Control.
- Go to Preferences -> Package Control and enter 'Install Package'. As soon as repositories are loaded, type 'xdebug' and select 'Xdebug Client'.
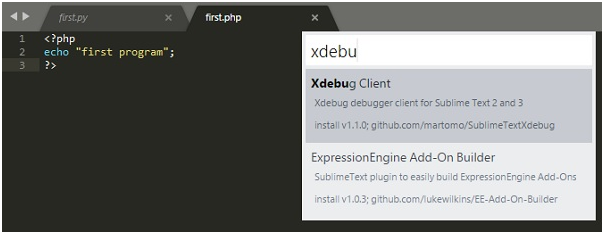
Image source: tutotialspoint.com
- Now, Xdebug might be installed but isn't configured correctly yet. To configure, check your PHP info from the browser to verify and locate the xdebug ini
- Open this file and make sure the following configuration is added:
|
[xdebug] xdebug.default_enable=1 xdebug.remote_enable=1 xdebug.remote_handler=dbgp xdebug.remote_host=localhost xdebug.remote_port=9000 xdebug.remote_autostart=1 zend_extension="/usr/local/Cellar/php55-xdebug/2.2.6/xdebug.so" |
- Once the configuration is added and now you can start debugging.
Place breakpoint in one of your files, at a certain line by right clicking > Xdebug > Add/Remove Breakpoint. At this breakpoint, the website will freeze, and all available variables will be displayed in the debugging windows on the bottom of Sublime. You can set multiple breakpoints and step them one by one.
- To start the session, go to Tools -> Xdebug -> Start Debugging. Now the debugging layout will appear in Sublime.
3. PHP debugging in NetBeans
Next, IDE is NetBeans, which offers a better user interface over other IDE’s for PHP development. It is a free open-source IDE for web developers. It includes all the tools required to create large-scale web apps and it supports almost all programming languages like PHP, C/C++, Java, and others.
To successfully debug PHP code in NetBeans, you should have PHP engine, the apache local web servers, as well as Xdebug, installed & configured. Here we are using Apache/PHP installation. Fortunately, XAMPP is already configured with Xdebug and includes the configuration in php.ini, you need to make only few changes & restart Apache.
- Open php.ini in your editor. For us, it is likely in C:\xampp\php.
- Locate the [XDebug] section and edit the values as shown below. Many of the values are defaults, but make sure you don’t have different values:
|
xdebug.profiler_enable = 1 xdebug.profiler_enable_trigger = 1 xdebug.remote_enable = 1 xdebug.remote_host = "localhost" xdebug.remote_handler = "dbgp" xdebug.remote_mode = "req" xdebug.remote_port = 9000 xdebug.trace_output_dir = "C:\xampp\tmp" |
- Restart your Apache using the XAMPP control panel.
Besides questioning the best IDE for PHP development, developers are asking the same question, Which IDE is best for PHP debugging? These three handpicked IDEs can supports PHP debugging compiled with Xdebug plugins. Configure your PHP Xdebug with any of these IDEs and ensure flawless web applications.


