


Discover top data analytics tools for gaining valuable insights and turning your data into actionable information.
Data analytics tools are indispensable instruments in the hands of an enterprise striving to extract any value out of its data toward informed decision-making, optimization of operations, and improvement in customer experience. The landscape of data analytics tools is evolving more with infusions that support AI, ML, and easy interfaces. Here is a sneak peek into some of the most potent data analytics tools based on their features and user reviews that will guide you through making your pick according to your business requirements.
Top Data Analytics Tools: Features, User Reviews, and Popularity
#1. Power BI
Features:
- Integration with Microsoft products
- Customizable dashboards
- AI-powered analytics
- Extensive data connectivity options
- Secure publishing and sharing
Popularity and Stats: Microsoft Power BI enjoys massive popularity with businesses that are already entrenched in the Microsoft ecosystem as a Data Visualization Tool. The ventilation with Excel and Office 365 tends to attract many towards it.
Review: Reviewers liked the cost and the ample integration with Microsoft services, but some of them found that the interface wasn’t very user-friendly compared to Tableau.
#2. Tableau
Features:
- Intuitive drag-and-drop interface
- Robust visualization capabilities
- Supports a wide array of data sources
- Real-time data analysis
- Mobile-friendly dashboards
Popularity and Stats: As per a few recent surveys, it has been stated that Tableau enjoys an extremely high adoption by the Fortune 500 companies and is particularly well-liked for the kind of fluidity it brings to handling large datasets.
Review: Tableau is renowned for its rich set of visualization tools; this is fairly easy to use, making it very intuitive even to users with little technical background. Well, the issue normally has a price attached that would not be said to be very friendly to most small businesses.
#3. Google Analytics
Features:
- Web and mobile analytics
- User behavior tracking
- Custom reports
- Real-time analytics
- Integration with Google Ads
Popularity and Stats: Google Analytics is the most popular tool used to analyze website and mobile app performance. Free version: Widely used by small and mid-sized businesses.
Review: The tool has been applauded for the provision of sophisticated details in web analytics and interrelations with other Google services; nonetheless, it supposedly poses a higher learning curve due to the advanced features.
#4. SAS Analytics
Features:
- Advanced statistical analysis
- Predictive analytics
- Data management
- Visualization capabilities
- Text analytics
Popularity and Stats: The SAS is a statistical and analytic workhorse, which explains why it is found in such healthcare, banking, and retail operations.
Review: SAS is strong in advanced analytics features and robust in support. Still, its cost and complexity make it a product geared more toward very large companies with specialized teams.
#5. Python with Pandas and Jupyter Notebooks
Features:
- Open-source programming language
- Extensive libraries for data analysis and manipulation (Pandas)
- Interactive computing and visualization (Jupyter Notebooks)
- Machine learning capabilities (Scikit-learn)
Popularity and Stats: According to PopSci, Python has become one of the top languages in the field of data science. The language is widely supported and well-developed, especially in the scientific area, which can be seen through the numerous libraries tailored for solving problems tied to scientific programming.
#6. Zoho Analytics
Features:
- Self-service BI and Analytics to create and share dashboards
- AI and Machine Learning for insights through natural language querying.
- Data Integration with numerous data sources.
- Collaboration for sharing reports and dashboards within teams.
Review and Popularity: The online analytical processing tool’s interface is extremely user-friendly, and the tool is highly rated because of this reason; in addition to this, it is considered an inexpensive option for small and medium businesses. Easy to use and friendly in nature towards the end user for building even very detailed reports and dashboards. But it may not support some features pertaining to advanced analytics that the other niche tools offer.
#7. Apache Spark
Features:
- Speed for fast processing for large-scale data operations
- Ease of Use for APIs in Java, Scala, Python, and R
- Advanced Analytics: Supports SQL queries, streaming data, machine learning, and graph processing within the same application.
- Scalability: Designed for scalability, Spark can run on a laptop or scale up to thousands of nodes in a cluster.
Review and Popularity: Apache Spark is one of the most popular technologies in the data science field. Due to its high processing speed and efficiency in dealing with complex analytics over huge data sets, it is widely accepted in the big data community. More so, it is particularly popular for applications that demand real-time analytics and machine learning. The learning curve, as well as the resource management of the tool, might pose a challenge for newbie users as well as small teams with no substantial technical support.
#8. QlikView
Features:
- Offers interactive guided analytics and dashboards.
- Enhances data processing speed and performance.
- Capable of integrating data from various sources into a single application.
- Provides a highly customizable environment to meet specific business needs.
Review and Popularity: QlikView has been greeted as one of the revolutionary applications in the BI software, enabling powerful in-memory data processing and highly interactive dashboards for better decision-making, thus making it an ideal application for businesses targeting data discovery and visualization. Deep down, it manages to solve the problem of how to have a legible conversation with complex data models.
Reviewers mention a rather steep learning curve and the struggle while transitioning to its new platform, Qlik Sense, which, however, is a demonstration of a much fresher face in modern business intelligence.
Comparison Chart
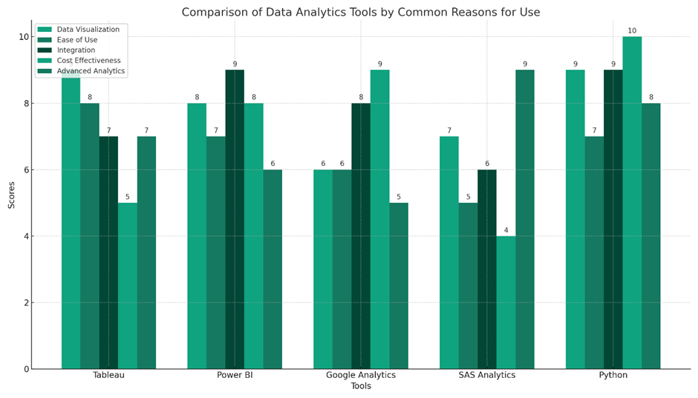
The above bar chart compares leading data analytics tools by the major reasons they are commonly implemented in businesses: Data Visualization, Ease of Use, Integration with other tools/systems, Cost Effectiveness, and Advanced Analytics capabilities. For each aspect considered, a score out of 10 has been applied to enable a comparison between these critical factors.
- Tableau & Python top the list for data visualization capabilities. It further underlines their strength at presenting data in an accessible yet impactful way.
- Power BI led the pack in integration, inside the Microsoft ecosystem, which makes it highly valuable to firms already utilizing Microsoft products.
- Google Analytics scored best on cost; this reflects its low entry point and scalability for small to medium-sized businesses.
- SAS Analytics leads advanced analytics and is suitable for firms where statistical analysis and predictive modeling need to be taken to a higher level.
Why do Businesses Use Data Analytics Tools?

This graph visually demonstrates the manner in which these top data analytics platforms facilitate businesses, showing the reasons that are most common for their choice and application in a working environment.
Organizations doing business in today's data-driven world experience an ever-growing amount of data. Proper utilization of this information may result in substantial competitive advantages, well-informed decisions, and improved efficiency of operations. Below are some reasons why organizations should use tools for data-driven decisions:
-
Informed Decision-Making: Business Intelligence software gives businesses active insights by working with a huge amount of data. These sharp views let leaders make choices based on facts rather than feelings or guesses, leading to more right and good results.
-
Identifying Trends and Patterns: With the help of these tools, organizations will be able to spot trends and patterns within their data. Trends and patterns are usually not visible when using manual analysis. This capability can be used for the prediction of future movements in the market, understanding customer behavior, as well as hidden growth opportunities.
-
Enhancing Customer Experiences: Data analysis tools can deeply comprehend the preferences, behavior, and feedback of customers. Firms then slightly or significantly change their offerings, service delivery, and on-set of marketing approaches to align with the exact needs of the particular customer, increasing his/her satisfaction level and loyalty to the brand.
-
Streamlining Operations: Businesses get to see where they are going wrong and in which aspect of their process by analyzing operational data. This leads to streamlined operations, further inspiring reduced costs and improved quality associated with a product or service.
-
Risk Management: Data analysis empowers businesses with the capability to fairly assess their risks by reviewing historical information and identifying any possible concern long before it actually becomes a problem. This preemptive methodology toward controlling risk can save resources as well as maintain the good name of the business.
-
Competitive Advantage: A very major advantage is that access to and familiarity with data in a highly competitive marketplace will unhesitatingly place anyone at a very marked degree of advantage. Firms that are able to apply high acumen in using data intelligently stay ahead of trends, respond more rapidly to market changes, and meet customers' requirements before their competitors can do so.
-
Increased Efficiency: Automated data analysis is easily attainable with tools; this means workers can concentrate on more valuable work, hence faster decisions, lowered labor costs, and even better operation scaling because the process runs smoothly.
-
Data Integration: Most data analysis tools allow integration of information from different sources, showing all aspects of the business. It is in this integration that adequate and correct information becomes the basis on which decisions are made.
-
Regulatory Compliance: Regulatory Compliance Data analysis tools can help ensure and demonstrate compliance by monitoring and reporting all relevant data in real time to the business as it operates within highly regulated industries.
-
Innovation and Growth: Ultimately, insights gained from data analysis spur innovation via a continuous unveiling of new business opportunities, markets, and areas for expansion. A data-driven business is always positioned to grow amidst any form of market dynamism. Data analysis tools are thus very instrumental when it comes to the survival of modern businesses in a world that is predominantly driven by data. They provide a base for decision-making, understanding customers and serving them better, optimizing operations, as well as sustaining the lead.
Conclusion
The correct data analytics tool for your business in 2025 and beyond depends on your specific needs, including the complexity of your data, your team’s technical expertise, and your existing tech ecosystem. Tools like Tableau and Power BI continue to dominate for their comprehensive features and ease of use. At the same time, platforms like Google Data Studio offer cost-effective solutions for those deeply integrated into the Google ecosystem. Meanwhile, advanced solutions like SAS Visual Analytics cater to enterprises with complex, high-stakes analytics needs.
When choosing a data analytics tool, consider scalability, integration capabilities, support, and community resources. Remember, the best tool is the one that aligns with your business goals, enhances your decision-making processes, and provides actionable insights to drive growth. Connect wth Data Analytics experts at Clarion to get started.
Author

Vishal Pawashe - Sr. Software Engineer - L2
Vishal Pawashe, an adept Power BI Practice Lead, elevates organizations with strategic leadership in data visualization, translating data into actionable insights. With a proven track record, he excels in leveraging Power BI for informed decision-making, showcasing expertise in Microsoft Power Automate, POC, Presales, Marketing Strategy, Resource Management, Webinars, AI, Python, VBA Programming, Chatbot Development, Excel, Practice Management, ChatGPT, Power Apps, Power Virtual Agents, Tableau, Microsoft SQL Server, and Birst.

.png?width=375&height=240&name=MicrosoftTeams-image%20(18).png)
