


In this world of big data, enterprises are generating immense amounts of data. Once an enterprise has deciphered how to make use of the various data sources, generating data as well as the technique for collecting, processing & storing it, the next phase is analysis. The big data analysis methods vary based on use cases and the data itself, but the pace of visualizing the data is now becoming a standard best practice.
Data Visualization supports users to detect a pattern, monitor the environment and take actions when detecting anomalous behavior. Currently, the market has a huge list of data visualization tools that provide the visibility needed for understanding and analyzing the given data.
Explore the features of big data software
Elastic Kibana is the most popular open source analytics and visualization platform designed to offer faster and better insights into your data. In this post, we will discuss this cutting- data visualization tool and its important features.
Overview of Elastic Kibana
Kibana is a visual interface tool that allows you to explore, visualize, and build a dashboard over the log data massed in Elasticsearch Clusters. Elastic is the company behind Kibana and the two other open source tools - Elasticsearch and Logstash. The Elasticsearch tool serves as the database for document-oriented and semi-structured data. Logstash supports to collect, parse, and store logs for future use. These three tools can work well together and popularly known as ELK Stack or Elastic Stack.
The core feature of Kibana is data querying & analysis. In addition, Kibana’s visualization features allow you to visualize data in alternate ways using heat maps, line graphs, histograms, pie charts, and geospatial support. With various methods, you can search the data stored in Elasticsearch for root cause diagnostics.
With Kibana, it is easy to understand big data, and you can quickly build and share dynamic dashboards that frame-out changes to the Elasticsearch query in real-time. This visualization tool is equipped with various options in its left panel as shown below:
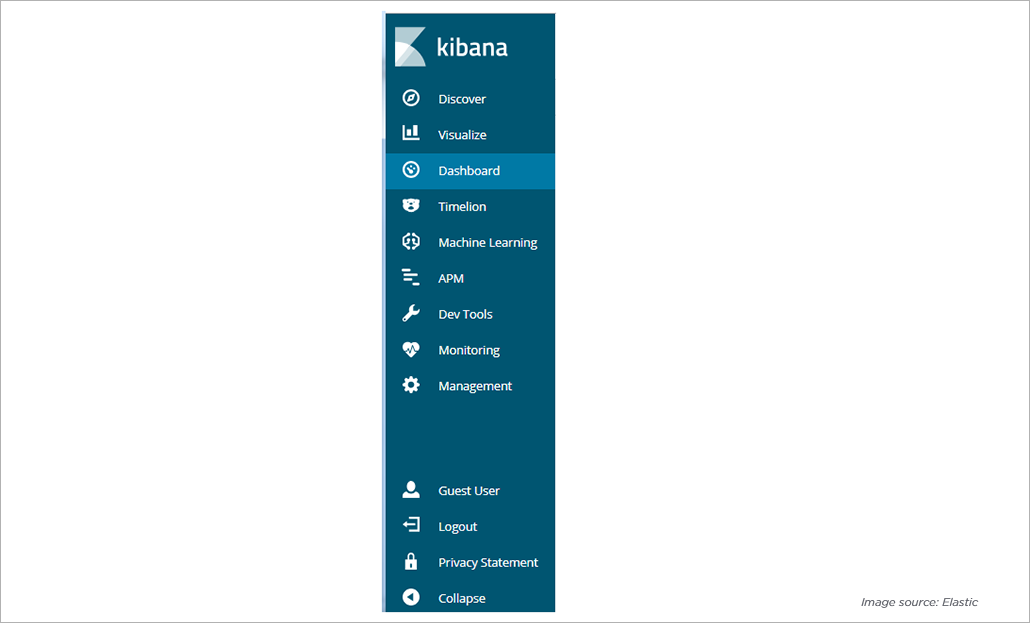
Discover
The Discover page ensures interactive data exploration by enabling access of each field in conjunction with default time. You can set the time filter, submit search queries, view document data, and filter the search results.
Visualize
With the broad variety of visualization styles, Kibana allows you to create a visualization of your data in the Elasticsearch indices. The screenshot below depicts the visualization page: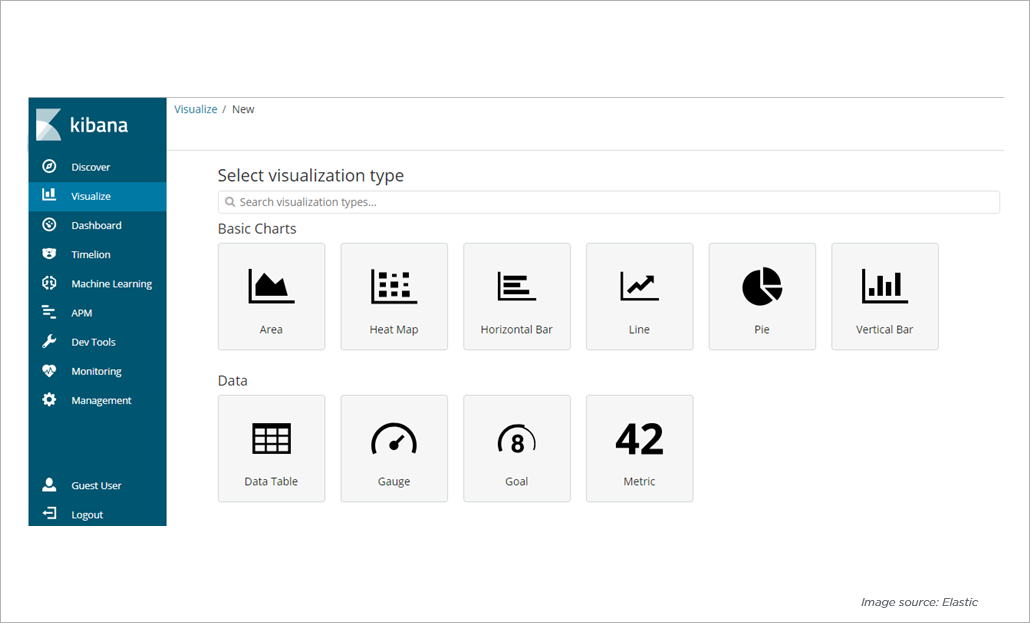
You can combine pie charts, data tables, line charts, single metric visualization, time series, Geo maps, and markdown visualization into dashboards.
The following table lists down the available Kibana visualization types and their description: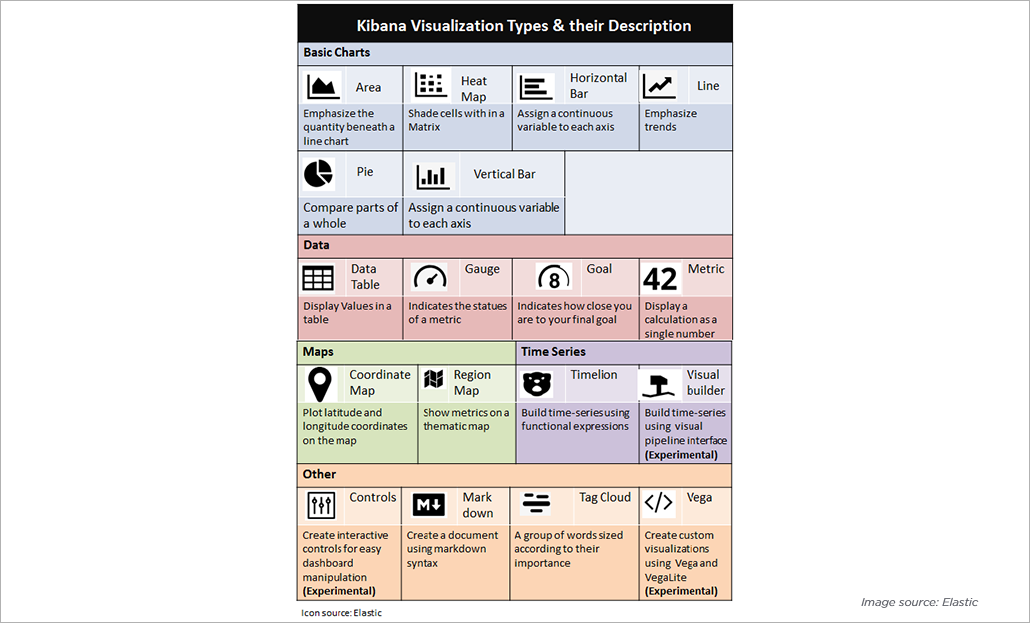
Dashboards
This page displays the pool of visualizations and searches. The Kibana dashboard is extremely dynamic and adaptable. For example, you can filter the data on the fly and open the dashboard in full-page format. The customizable dashboard feature allows you to resize, arrange, and modify the dashboard content and save it so that you can share your dashboard.
Timelion
Timelion analyzes and visualizes the time series data using simple expression language and it is designed to bring together the completely independent data sources within a single interface. It offers a way to define queries, visualization, and transformation in one place.
Machine Learning
The complexity and extensions of datasets make it difficult to identify cyber-attacks, infrastructure issues, and business problems. However, the Kibana’s machine learning page intends to create anomaly detection jobs and observe results. This feature automatically models the behavior of the Elasticsearch data, including periodicity & trends and spot issues faster thereby reduce false positives.
APM
Application Performance Monitoring system supports users to monitor the applications as well as services and collects deep performance metrics and errors. Thereby the developers can inspect into performance data for their apps and rapidly spot the performance bottlenecks.
Dev Tools
The Dev tools of Kibana provide a powerful way to interact with the ElasticStack. As it includes Console that supports developers to write Elasticsearch commands in one tab and view those commands in the different tab. Together with Console, a Grok debugger and a search profiler in this solution allow you to configure the app to meet your needs.
Monitoring
The monitoring page of Kibana serves you in three effective ways:
- You can visualize the data across Elastic Stack as it includes options to monitor the performance data for Elasticsearch, Kibana, Logstash as well as Beats in real-time
- You can also analyze the past performance of these products
- You can ensure deep monitoring of Kibana and direct that data towards monitoring cluster
Management
The management page of Kibana is used for performing Kibana’s runtime configuration, which includes three vital actions:
- Index pattern – supports for initial setup & ongoing configuration of index names
- Saved objects – hosts the saved visualization, dashboards, and searches
- Advanced settings – includes setting to tweak the Kibana’s behavior
Therefore, whether it is setting up security controls, adding data sources or handling pipelines, Kibana offers you a single interface solution.
What is Kibana used for?
For those of you who aren’t acquainted with this data analytics and visualization platform, here is a brief about the features that Kibana offers for you:
-
Interactive Charts
The in-built intuitive charts and reports of Kibana ensure the interactive navigation through the huge volume of log data. Moreover, you can dynamically zoom in & out the certain data subsets, drag time windows, and drill-down on reports to obtain actionable insights from the data.
-
Pre-built Aggregations & Filters
These features enable you to run a variety of analytics like top-N queries, histograms, and trends with a few clicks.
-
Anomaly Detection
As said earlier, the machine-learning feature of this visualization tool supports you to detect anomaly even hidden ones in your data. This capability allows you to identify the root causes of issues as shown below: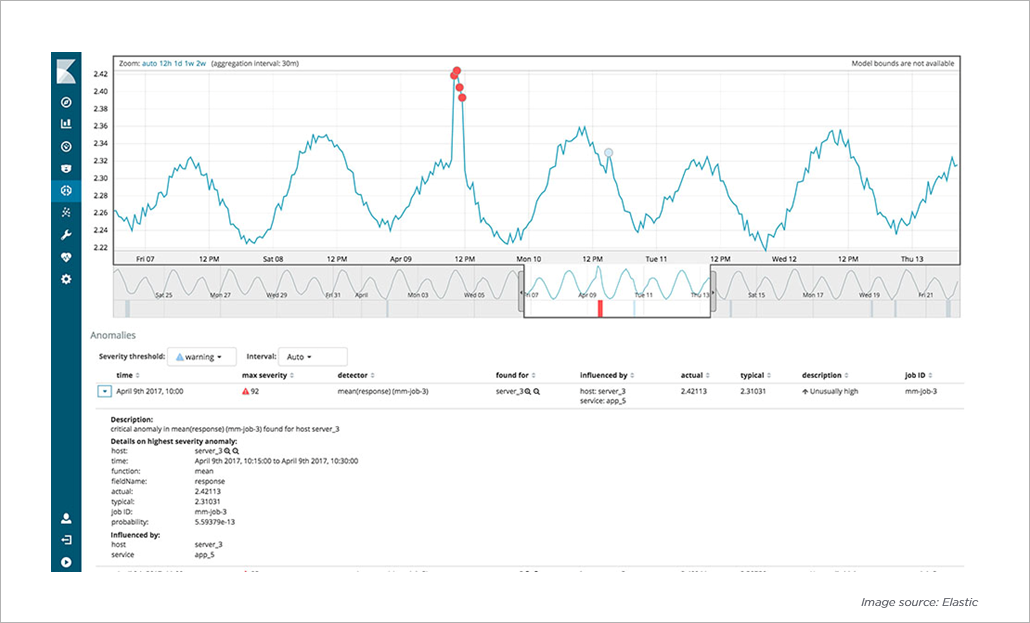
-
Secure Sharing and Collaboration
Kibana ensures secure sharing of your visualization and dashboards, as there is an option that restricts the information viewing to protect data leakage. You can share your data, visualizations and even dashboards with your team members, boss, and customers who want to view the same details what you are viewing in Kibana.
In addition, the Kibana Dashboard Only Mode also supports to build a restricted access user, with limited visibility.
-
Graph
Besides, the plotting of data points, Elastic Kibana allows you to uncover the relationships between them. You can accomplish this with the powerful graphical exploration API, which provides an alternative way to explore as well as summarize information about the data in the Elasticsearch index.
-
Kibana Search
The Kibana is empowered with various methods to perform searches on the log data. The following table describes the common search methods that should be considered for optimized user experience: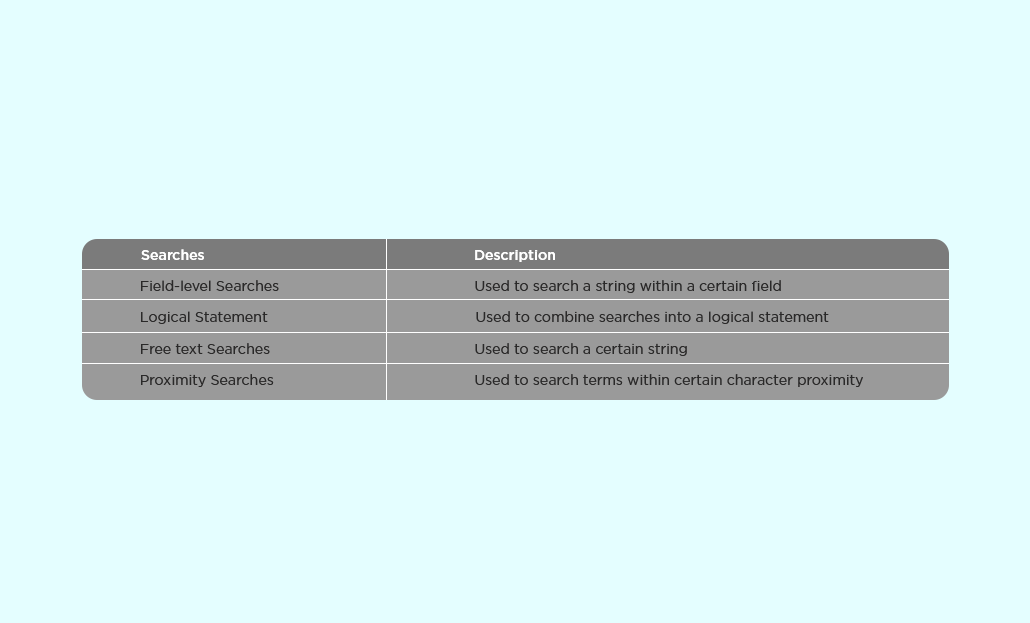
-
Mapping Support
The powerful geospatial features of Kibana make you seamlessly visualize geographical information over your data and observe the results on maps. The Elastic Maps service drives the geospatial visualizations in Elastic Kibana by aiding shape files, baseman tiles and key features that are vital for geodata visualization. The following screenshot depicts visualization on geospatial data: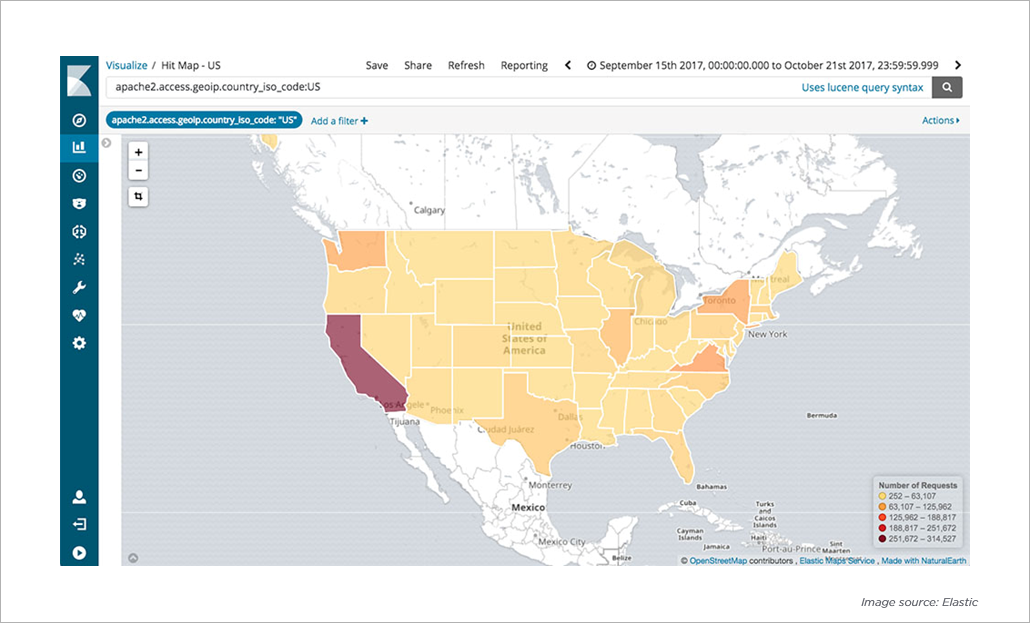
In addition, a recent data layer update allows you to view more countries in Kibana region maps.
-
Canvas
Canvas application in Kibana offers you a new way of making your data appear outstanding. Rashid Khan, the Kibana’s creator states, “Canvas is a composable, extendable, and a creative space for live data.” Get your imaginations into the live data with logo, colors, text, and shapes, which make your brand unique.
-
Watcher UI for Threshold-Based Alerts
The new UI of Kibana 6 creates and edits alerts based on thresholds. By previewing the alert constraints, it provides graphical feedback and type-ahead suggestions. In addition, it aids by sending alert messages along with template values to the email, log or slack.
-
Reporting
One of the best features of Kibana is its reporting option that allows you to quickly generate reports of your visualization or dashboard. You can schedule the report for later, get it on demand and trigger it as per certain conditions. You can also automatically generate reports by submitting HTTP POST requests and it is possible to share it with others.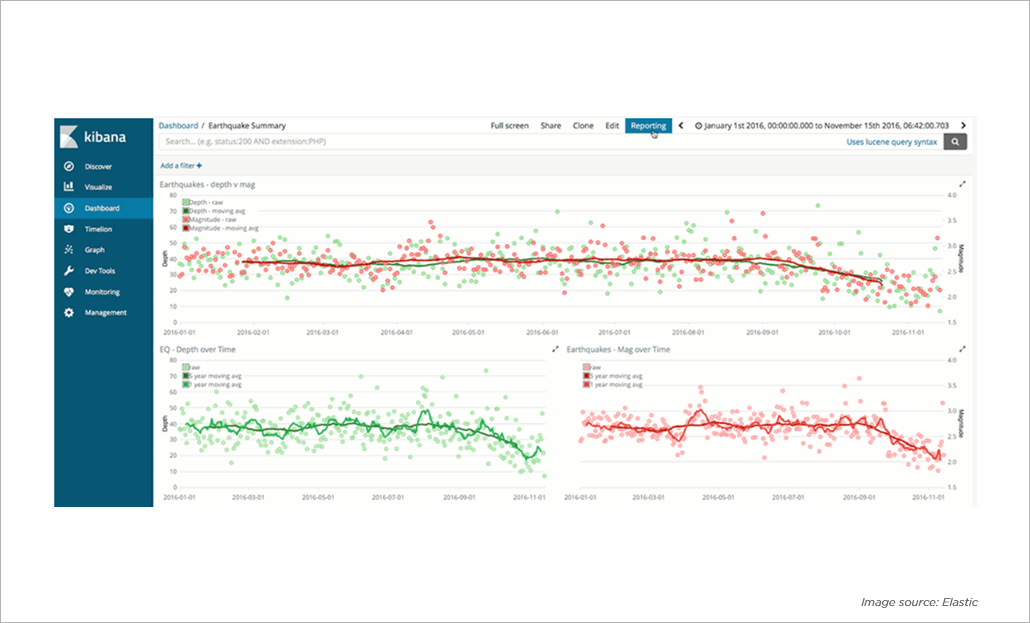
With powerful features like real-time analytics, customizable dashboards, and seamless integration with Elasticsearch, Kibana can improve your data-driven decision-making. Want to calculate how this will affect your business? Use our ROI Calculator to evaluate the potential financial impact.
Conclusion:
In this article, we have shared an overview of Kibana log analysis tool along with its attractive features that illustrate its offerings and capabilities. Undeniably, these features make it the best data visualization tool in the market now.


