


There is a tremendous rise in the need for big data analytics in the last few years. Businesses experience extreme challenges while filtering information from both structured and unstructured data scattered across the diverse architecture. Emerging technical platforms offer enhanced power to understand and analyze the big data. For unlimited access to big data, enterprises should adopt a big data software that integrates and analyzes larger sets of data on a massive scale. In addition, the software enables improved visualization as well as statistical modeling, which offer the immense number of details in understandable forms. There are plenty of technologies and software vendors that can be branded as sources of big data. The admirable features of the software encourage several businesses to invest in big data analytics software. Let us dig deep into some of the most common capabilities of big data tools available today.
Why Do We Need Big Data Analytics Software?
An enterprise that applies big data tools will be better capable to understand its business as well as its environment. It will enhance the power to convey the right decision at the right time and as such capture the right opportunities to develop a competitive advantage.
The big data analytics software with descriptive and diagnostic analytics empowers an enterprise to use a wide variety of structured data sources to obtain insights into what has occurred - commonly referred to as business intelligence. In addition, software that supports predictive analytics uses artificial intelligence and machine learning to identify patterns and recognize relationships in various structured and unstructured data sources to create future predictions.
Learn more about the benefits of big data software
Standard Capabilities of Big Data Analytics Software
The big data software market becomes more competitive, and plenty of vendors are providing a broad range of big data analytics solutions. Let us look at ten of the most vital big data analytics features that a business can expect from a prospective solution.
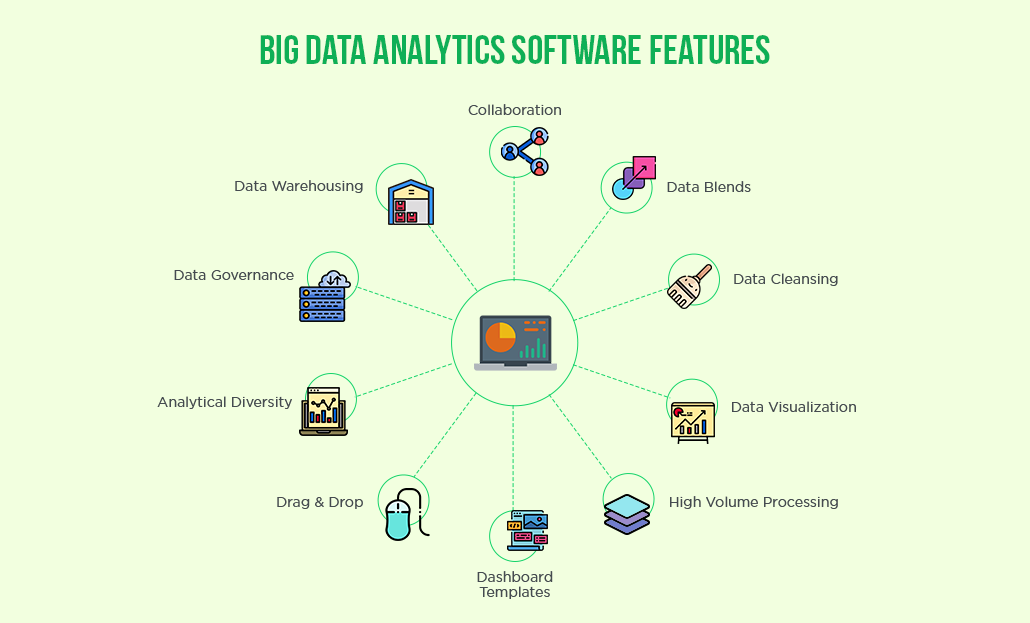
1. Collaboration
Collaboration feature allows departments, teams, and enterprises to enhance analytics adoption through interactive discussion threads as well as an inbuilt comments panel. Along with real-time notifications, alerts, and easily sharable customized views, employees can incline to a comprehensive view of their business and achieve enhanced teamwork. This capability catalyzes enterprise to overcome obstacles in cross-functional and structural collaboration. In addition, multiple departments can work in synchronization with the data and make the ongoing stream of raw details to be valuable. Some big data tools have included the capabilities to collaborate with various stakeholders to make the best result for their business since they feel more responsible for the enterprise’s success. With the extended capabilities such as shared dashboards and charts, role-based permissions, PDF exports, and agency tools, the software turns scattered data into actionable insights. Furthermore, collaboration and deployment services of many tools allow to deploy and share predictive analytics across the organization. The solution offers centralized and protected storage for analytical assets, as well as advanced features to control and manage predictive analytic processes.
2. Data Blends
As data analysis begins with preparation, most visual analytics tools offer a range of data blending functionality along with data analysis features. This functionality empowers the big data exploration to join data from various sources without requiring moving it into any data mart or warehouse. Just consider the following scenarios where data blend is in action:
- When an application uses data in Hadoop, but a user likes enriching that data with the customer demographic reference details or transactional data kept in an Oracle database.
- When there is a flow of sensor reading and the user wants to carry out calculations across that real-flow stream and comprise historical metrics.
- When the user has product reviews, in elastic search and he wants to correlate them with purchase history in an organization’s data warehouse.
All of these situations demand data blending across various sources to attain the most valuable insights. Furthermore, the data-blending feature allows obtaining the data fast while enhancing the intelligence of big data efforts and improving the user experience.
3. Data Cleansing
Most of the industries that depend on data are going through millions of data manually that is possibly a daunting and error-prone task. The analytics tools that systematically evaluate data for errors using rules, look-up tables, and algorithms prominently include the data cleansing capability, to automatically clean as well as prepare data with a data health check-mode. The data analytics tools ensure that the data received are accurate by fusing up-to-date error-free data and considering all data, no matter how disparate or larger the source. Therefore, everyone in the enterprise can analyze the same data and depend on a single source of fact. Thereby, the software assures that the trends the team discovered are of high quality and also offers decision-makers with the accurate details. Most of the data analytics tools support to remove the guesswork by automating and simplifying the data cleansing. Following are the data cleansing examples that can be achieved with big data tools:
- Removing null values
- Removing errors
- Data record deduplication
- Data matching
- Removing nonsense values
- Fixing records as per the predefined rule set
4. Data Visualization
The data visualization feature in big data analytics tools can be an ideal option to bring data to life. Charts, dashboards, graphs, gauges, word clouds, geospatial maps, theme maps, and other visualization techniques support to depict the key messages in the data. It can be a worthy functionality for presenting details in a quick and effortless to digest manner. It also supports the users to absorb both semi-structured and unstructured data. Interactive, web-based dashboards of some big data software ensure that users are able to understand information in the most expressive way with extended competence to filter as well as drill-down the data.
Some vendors have started including dynamic visuals and interactive reporting functionality that makes the query changing considerably simple by just clicking a section of the chart or graph. It benefits to drill down the report to visualize the smallest details and combine multiple views to observe the bigger picture. This feature also reduces the effort tangled in testing new guesses about the data to clear the bad ones faster as well as streamline the finding of valuable connections resides in the data.
5. High Volume Processing
Today, the big data analytics software is equipped with the power to compress massive amounts of data that offers users with an unprecedented speed of access to granular facts. The streaming analytics option of the software empowers the user to collect, monitor, and recognize live streams of data as it is created to determine correlations and facilitate the immediate vision and action. By generating visions from the high volume as well as high-velocity data, this feature supports to discover the relationships between business processes to reveal trends and patterns. It offers a recent view of scenarios, so business can anticipate short-term demand changes.
6. Dashboards Templates
The simple interface of big data tools allows non-technical users to access data and create interactive dashboards. The broad variety of dashboard widgets in the tools support to select the best visualization for the data like gauges to measure KPIs, geographical maps, scatter plots to observe correlations, line charts to discover trends and pie charts for effective comparisons. In addition, it allows users to customize the dashboard layout with drag & drop features and place each widget precisely where they want for optimal presentation. Every template of the dashboard comes with several widgets and filters that can be added and removed in a click.
7. Drag & Drop
The next feature that is interrelated with the above one is drag & drop functionality that enables no code or less code sandbox. With this capability, users can drag & drop static and interactive data onto an empty canvas, personalize the look & feel of each page or view within the application to achieve their unique requirements. When it comes to charts, users can get the suggested charts in accordance with their specific data or they can merely compile their own charts from the beginning. With this feature, filtering, segmenting, cohort analysis and more are at the user’s fingertips. Thereby they can create beautiful data dashboards and data visualizations that they can share with their team and clients.
8. Analytical Diversity
As there is demand for various sorts of analytical modeling, most big data software vendors have invested in tuning different versions of their algorithms and appending functionalities that are more sophisticated. As a result, organizational users are able to support several analytics capabilities with wide varieties of modeling like clustering, regression, behavior modeling, decision trees, and many more.
Based on their use case and applications, they can choose the most relevant models for their problems and can evaluate the products to find how they serve their user’s business needs. Some high-end big data analytics tools include a gallery that comprises time series, linear & logistic regression, neural networks, sequence & web path analysis, link analysis, and market basket analysis. Another factor of analytical diversity deals with integration with statistical tools and programming languages for adopting user-friendly functionalities and existing libraries. Good data analytics software can act as functional as well as flexible enough to aid these different analytical use cases effortlessly.
9. Data Governance
With data governance features, the big data tools support enterprise to stay compliant as well as secure. This includes being capable to track the data source and its characteristics to design analytic models. It helps to secure and manage the data employed by the users. This feature especially supports sensitive data that demands to comply with security regulations. Some tools comprise the facility to pseudonymize data that allows users to develop models in accordance with personal information in compliance with privacy regulations.
10. Data Warehousing
Big data tools today make it simple to use the data warehouse based on the user preferences whether it is machine learning, ad-hoc analysis, operational analytics or data science. The tools allow looking past the pipeline to attain real and fast insights or access raw data. In addition, it is possible to load the data into any famous data warehouse in minutes and work with a broad range of integrations with cloud and existing enterprise applications.
The market of big data analytics tools can be wide-ranging, but hopefully, this blog has supported to understand the standard features that the software can offer to the organizations.


