Thought Leadership to Decode Innovation & Accelerate Smart Business Decisions.

Choose Value with Competitive Costs through our IT Outsourcing ROI Calculator. Get Your Report
Hire Pre-Vetted Engineers with 2-weeks, Risk-Free Trial Get Started
Build your own Agentic AI. Book a Slot

Case Study: Advanced Reporting Solution with Power BI for Oil and Gas Company

Case Study: Advanced Reporting Solution with Power BI for Oil and Gas Company
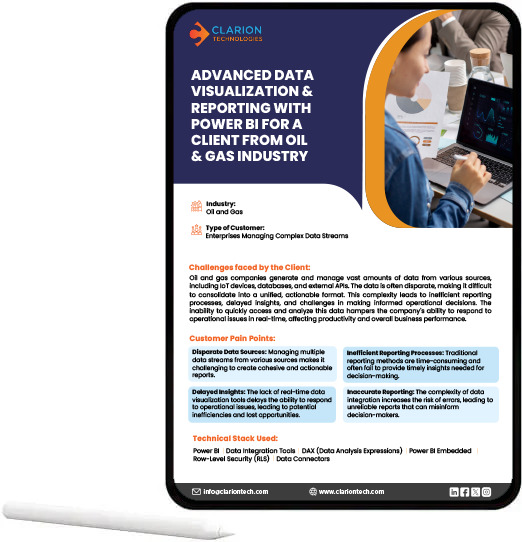
Improving Data Consolidation and Real-Time Insights with Power BI Analytics Platform - Clarion Case Study

An oil and gas company managed large volumes of operational data generated from IoT devices, enterprise databases, and external APIs. Isolated data systems and inefficient reporting processes made it difficult to generate timely insights, affecting operational efficiency and business decision-making. Clarion designed a Power BI-based reporting solution to centralize data visualization and improve reporting accuracy.

The Challenges:

  • Data fragmentation and lack of integration leading to complications in creating company-wide reports.

  • Reliance on traditional and time-consuming reporting practices resulting in delayed information delivery.

  • Lack of real-time visualization capabilities preventing quick response to errors.

  • Data integration complexities increased the risk of reporting inaccuracies and reduced confidence in business decisions.

The Solution:

  • Developed interactive dashboards and real-time reports using Power BI.

  • Integrated data from multiple enterprise systems using SSIS, Azure Data Factory, and Power BI connectors.

  • Created advanced business metrics and calculations using DAX.

  • Embedded Power BI dashboards into enterprise applications for seamless access.

  • Implemented Row-Level Security (RLS) for secure, role-based data access.

  • Designed operational, trend analysis, and departmental reporting dashboards across business functions.

The Business Outcomes:

  • Increase in efficiency of all reporting processes by 40% through automated consolidation of data.

  • Improvement of response time for solving operational problems by 30% through live IoT dashboards.

  • Reduction in the number of reporting errors by 25% by removing manual data manipulation.

  • Improvement of data security and compliance within departments due to Row-Level Security (RLS).

  • Faster forecasting and strategic planning through historical trend analysis and customized business reporting.

Frequenty Asked Questions

What are the benefits of using Power BI for enterprise data visualization?

Power BI helps companies transform disorganized and difficult data into organized information that is actionable. Some of the benefits of Power BI are:

  • Brings together information from a variety of sources in one platform.

  • Offers real-time dashboards to help decision-making become more efficient.

  • Allows custom metrics and calculations through DAX for tailored analysis.

  • Supports row-level security to control data access by user role.

  • Easily get integrated with existing systems for seamless data access.

Why is Row-Level Security (RLS) essential for implementing Power BI platform?

Setting up Row-Level Security (RLS) in Power BI enables companies to:

  • Apply strict rules so employees only get access to data tied directly to their job responsibilities.

  • Keep sensitive field and financial data safe without locking down reports that teams need for daily work.

  • Help companies stick to strict industry compliance standards and data privacy rules.

  • Keep embedded reports fully secure when staff access dashboards through internal company websites.

Why do oil and gas companies struggle with data consolidation?

Some of the common data management issues faced by energy companies are:

  • Handling data obtained from IoT devices, databases, and third-party applications.

  • Using old-fashioned reporting techniques that take much time.

  • Delays in getting insights caused by the absence of real-time visualization solutions.

  • Dealing with increased risk of errors from complex data integration.

  • Struggling to respond quickly to operational issues without unified reporting.