


This blog post revolves around Xdebug and its various aspects. We will be covering detailed information about Xdebug, how to install it, configure it, etc. We know it sounds great and you just cannot wait. Let’s get started.
What Is Xdebug?
- Xdebug is an extension for PHP to make your life easier while debugging your code.
- Right now, you may be used to debugging your code with various other simple solutions. These include using echo, var¬_dump, print_r
Debug Driven Development:
- Xdebug is proactively used during development itself, rather than reacting to issues with existing code.
- Think of this like Test-Driven Development (TDD) but using the debugger first instead of writing tests.
- Debug Driven Development (DDD) is a widely used term, but Xdebug may be used to help me write new code in a couple of ways:
-
- Inspect existing arrays, objects, and class instances to find the data available to me in code, so I can use it in new code I write
- Immediately debug a newly-written piece of code to test it is working as expected
Install Xdebug:
- Run the “Sudo apt-get install PHP-xdebug” command for installing the xdebug
- Configuring your IDE
- After installing Xdebug, you still need to configure your IDE to attach it to the debugger. In VS Code, this means adding a debug configuration.
Configuring VSCode to use PHP XDebug:
Step 1:
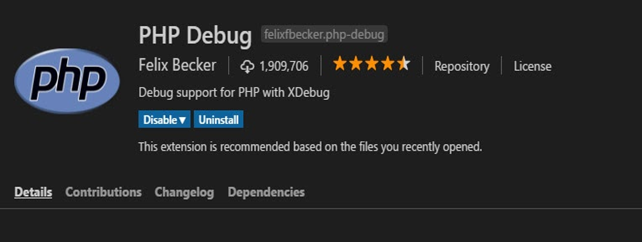
Check for PHP extensions in VS Code. Install the PHP Debug extension by Felix Becker. This can be done by clicking the extensions tab in VSCode and searching for ‘PHP Debug’.
- Click “reload” to reload VS Code.
Step 2:
- Configuring your IDE after installing Xdebug, you still need to configure your IDE to attach it to the debugger. In VS Code, this means adding a debug configuration
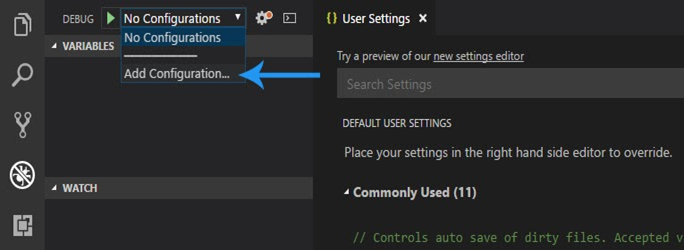
- Then, click on the Debug tab on the left-hand pane, click the debug drop-down, and select Add Configuration.
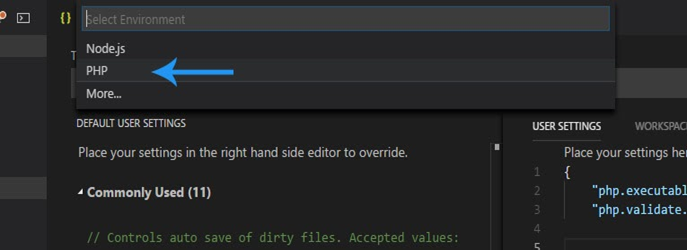
- Then, click the ‘PHP’ option from the drop-down that pops out.
Step 3:
- Now, if we want to be able to debug a script as a proper user, for example, debugging using a browser.
- What we need is an xDebug Helper, which is a Google Chrome extension available to use for free.
Find the extension by going to the Google Chrome Web Store. See the following steps –
- Goto the following URL Chrome Web Store Extensions
- Search for ‘xDebug Helper’
- Install the extension (It has a green ladybug in the logo) – See image below.

How to use:
Ok, so now both debug methods are set-up, how do we use them? It’s pretty simple. First of all, let us go through using the ‘Launch currently open script’ method.
- Go to any .php file, and add some breakpoints to your code.
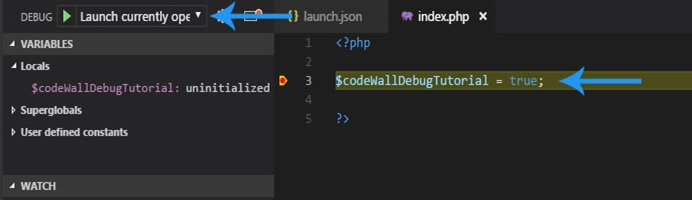
- Make sure that ‘Launch currently open script’ is already selected in the Debug drop-down in the top left of the debug window.
- Press F5 to start the debug process.
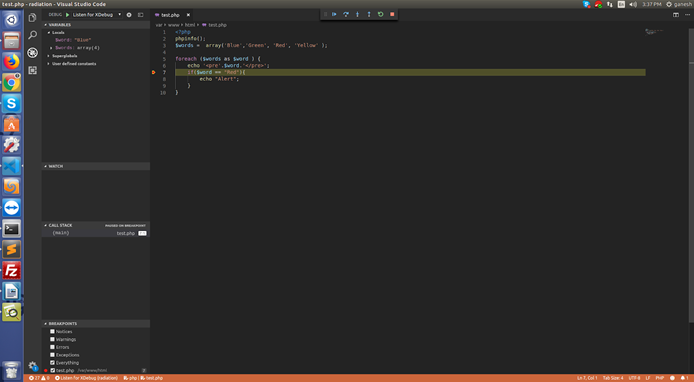
- You will see the debugger break at the first breakpoint, see the image below.
Listen for Xdebug:
Now, let’s go through the ‘Listen for xDebug method that takes the browser into account.- Open a .php file, for this example the index.php file in the root directory.
- Add some code and add some breakpoints. Use the F9 shortcut key to add breakpoints.
- Change the Debug select option to ‘Listen for xDebug’.
- Press F5 to start the debugger.
- Open Chrome and navigate to your index.php file, in my case its http://localhost/index.php
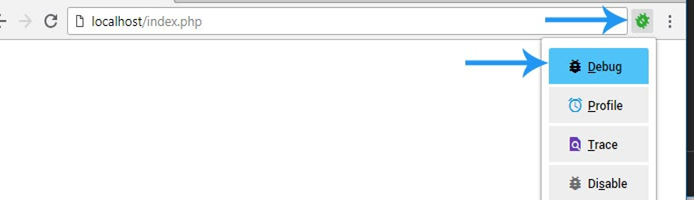
- Click the new XDebug Helper extension and click the Debug option.
- You will notice the helper icon will now turn green (See image below)
- Finally, refresh the page in the browser, and VSCode will react and start the debugging process.
- Go back into VSCode and you will see that it has stopped at the breakpoint.
VSCode Xdebug Bar:
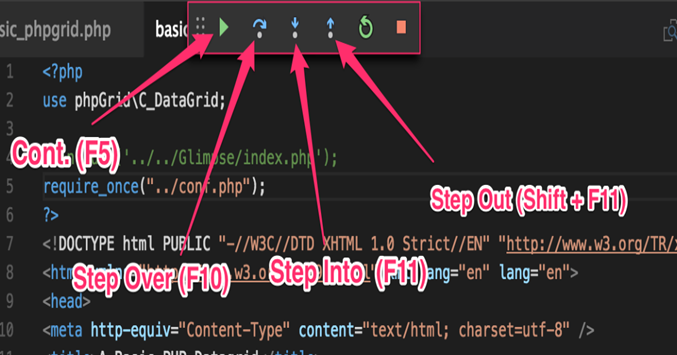
- Step Over: This means step one line ahead.
- Step Into: If the blue line highlights, for example, a function call, this button lets you step through the insights of the function.
- Step Out: If you stepped into a function and want to get out before the end is reached, just step out.
- Run to cursor: Let's say that, for example, your file is 100 lines long and your breakpoint was set at line two in order to inspect something. Now you want to quickly run to the point where you just clicked your cursor to - this button is for you. You can click "Step over" n times too.


