


Every business market is unique, and it has its own complications and challenges. Their customers are diverse in nature with clearly defined budgets, plans, and goals. Hence, businesses adopt different selling & marketing methods to offers various services and products.
In any business, systems generate a wide variety of data in the size of terabytes, petabytes or in some cases exabytes. Businesses analyze the this data and create actionable information (decisions) and the entire process is called Business Intelligence (BI). It is quite evident that the company’s success relies on these decisions that derive from business intelligence.
BI is an ever-growing technology dominating all businesses across the world. BI services are very much successful in ensuringa personalized experience to the customers. BI Services are widely diversified and businesses are leveraging the potential of this technology. One such technology is Power BI which helps to make complex business decisions.
Why Power BI?
Power BI is a new cloud-based Business Intelligence service provided by Microsoft and derived from its years of experience in relational databases like Access, SQL server etc. It is a business intelligence platform that allows businesses to clean and completely transform data into meaningful data. It thoroughly analyzes data and shares powerful insights.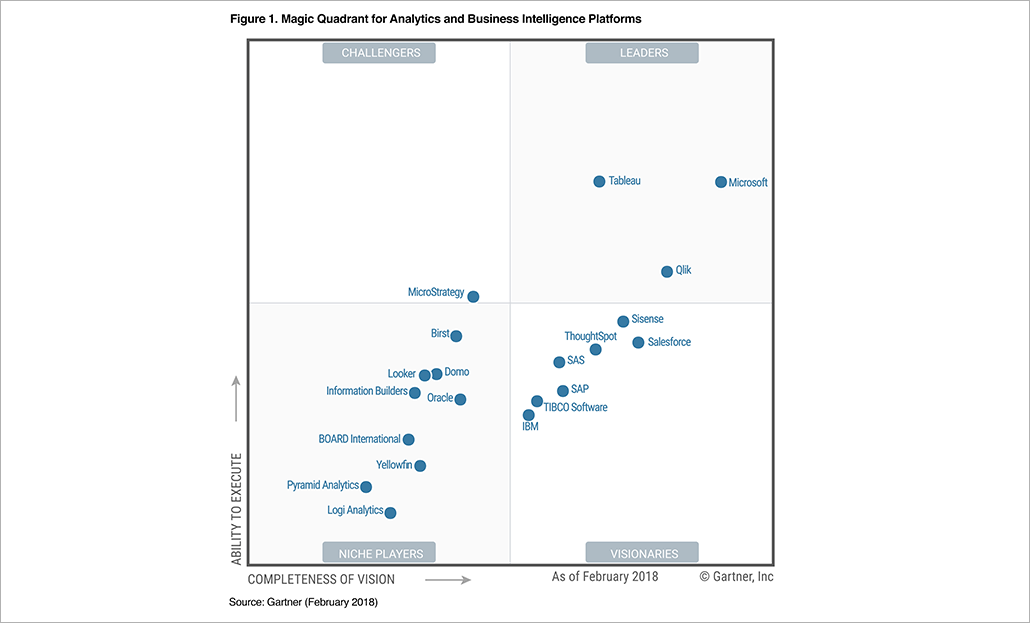
Microsoft is positioned in the leaders’ quadrant in the Gartner Magic Quadrant for Analytics and Business Intelligence Platforms 2018 edition which makes it the top player in the market. As per the Gartner Magic Quadrant, Power BI is considered as a go-to platform based on its vision of completeness and ability to execute BI solutions.
Below are the top 6 reasons why Power BI is best BI Platform currently in the market.
1. Ease of Use
Power BI has very simple and easy to use Interface. No programming experience is required to use Power BI.It has inbuilt intelligence which helps you to select attributes for your reports by suggesting the best reporting element.
Example: After selecting a right data source, when you opt for sales and category, it will automatically identify the column chart for you. Similarly, if you select sales and location, it will automatically identify the map chart.
It has a very simple user interface (UI) to connect to the data source. Upon selecting of data source, it allows selection of attributes by a simple drag & drop for your reports.
Among other features, QA is where you can write a question and Power BI will return a result with value or graph depending on the question. E.g. “What was this year’s revenue by month” generates a graph for you displayinga month-wise revenue.
The marketplace that comes with it provides a lot of reporting capabilities.

2. Easy to Learn
Power BI is developed on the founding platform of Excel and it follows a similar approach to design a report. Microsoft Excelis globally accepted and widely used software which makes Power BI easy to learn.
Data modeling is purely derived on the fundamentals of Microsoft SQL Server and Microsoft Access database. Hence users/programmers can very easily adopt the data modeling of Power BI.
Power BI comes with learning guides on their website.
3. Easy to Collaborate
Power BI comes with easy to collaborate options. The user can collaborate with co-workers to create interactive reports and dashboards in “app” workspaces. The user can compile dashboards and reports into apps and can publish them to a larger audience. Sharing dashboards or reports with a small audience is facilitated even over the Mobile App with Power BI.
The user can print the report and can export it in the form of PowerPoint Presentation. They can even publish reports and dashboards to public websites where anyone in the world can view and interact with it.
4. Cost Effective
Power BI desktop is free and the user can develop reports and dashboards that are easy and complex. The pro licenses of Power BI are within the affordable range (USD 10 per month). For a larger audience, Power BI has a premium option which allows you to customize costing based on your audience usage.
5. Wide Coverage of Data Sources
Power BI comes with a wide range of connectors for data sources like Microsoft Excel, SQL Server database, MySQL database, Oracle database, IBM DB2 database, IBM Netezza, IBM Informix, PostgreSQL database, Sybase database, SAP Hana, Amazon Redshift, Azure SQL Database, Azure SQL Data warehouse, Azure Analysis services database, Azure Blob Storage, MailChimp, Facebook, GitHub, Salesforce and many more.
6. Powerful Tool
- Visualization
Microsoft has opened up the visualization SDK in Power BI. It has a huge library for custom visualization. Use this functionality, the users can customize the UI as per their need.
- Data Shaping
Power BI offers a tool called Query Editor which is very flexible and powerful with tons of features. The most important aspect is that it is self-documenting. It also offers you an opportunity to go deeper inside the DAX language.
- Data Modeling
Any BI solution is strong if the BI model is well-developed. Power BI comes with very efficient data modeling options based on their experience of SQL database and Cube technology.
There are many more competitors of Power BI which offer similar features, like ZOHO Reports, IBM Watson Analytics, Sisense, Google Analytics to name a few. But Power BI stands tall in the market, mainly based on the easy of use and prompt Microsoft Help available for the tool.
Clarion has been working with our clients to formulate seamless BI solutions based on Power-BI and Cloud Analytics among a few. In case you are in doubt on the right BI tool for your organization and are looking for an implementation partner, feel free to reach out to us at info@clariontech.com .


